 main menu
| module menu
| << previous section
| next section >>
main menu
| module menu
| << previous section
| next section >>
Inspect
1. Getting Started
1.1 Overview
1.2 Starting Inspect
1.3 Loading Datasets
1.4 Saving and Printing
Objectives
- To introduce the basic features of Inspect.
1.1 Overview
Inspect is a versatile tool for efficient viewing of xy plots, such as doping profiles and I–V curves. Inspect extracts parameters, such as junction depth, threshold voltage, and saturation currents, from the respective xy plot. You can manipulate curves interactively or use scripts.
Inspect features a large set of mathematical functions for curve manipulation, such as differentiation, integration, and find the minimum and maximum. The Inspect script language is open to Tcl and, therefore, inherits all the power and flexibility of Tcl.
To generate presentation-ready and multiframe graphics, use Sentaurus Visual (see the Sentaurus Visual module).
1.2 Starting Inspect
To start Inspect, at the command line, type:
> inspect
Inspect takes the current directory as its working directory. With:
> inspect -f <filename>
Inspect can be run with an existing script (see Section 3.3 Scripts and Section 4. Extracting Standard Parameters). This capability is used when launching Inspect in a Sentaurus Workbench project.
When it starts, Inspect displays its main window (see Figure 1).
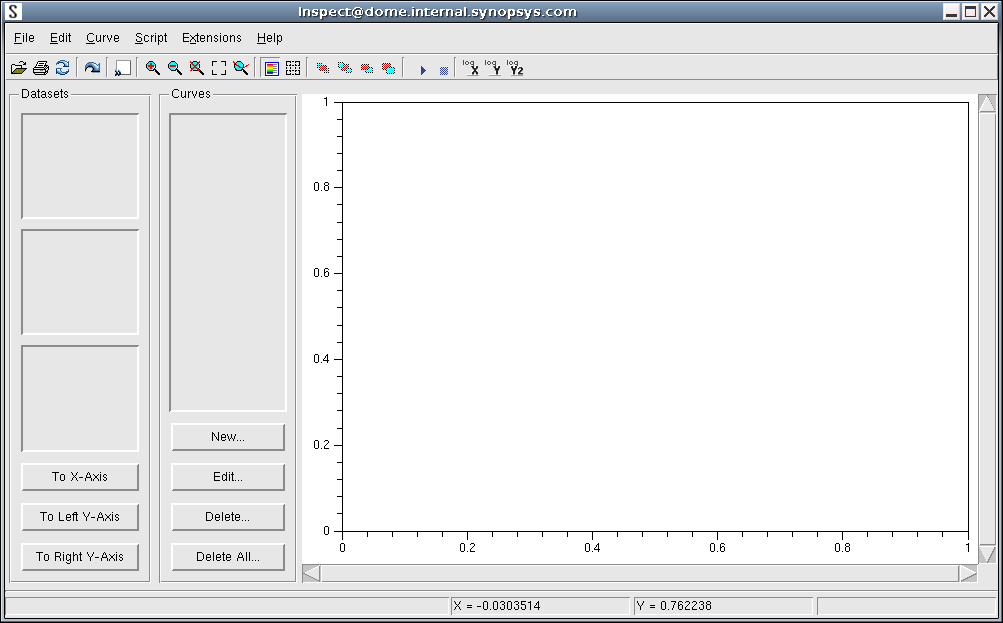
Figure 1. Graphical user interface of Inspect. (Click image for full-size view.)
The main window has several components:
- Menu bar and toolbar.
- The right pane is the plot area where plotted curves are displayed.
- The Datasets group box displays the loaded dataset files with their data components. The To X-Axis, To Left Y-Axis, and To Right Y-Axis buttons are used to map datasets to a particular axis.
- The Curves group box displays the names of existing curves. The New button is used to create a curve using the formula library (see Section 3. Math and Scripts), the Edit button is used to change the graphical attributes of a curve, the Delete button removes the selected curves, and the Delete All button removes all curves.
- The status line at the bottom of the window displays information about the current Inspect session and the position of the pointer in the plot area.
1.3 Loading Datasets
This section explains different aspects of loading datasets.
1.3.1 File Format
Before being plotted, a data file must be loaded. The data can be in the .plt format or in a simple columns format. The .plt format files are typically the output of TCAD tools such as Sentaurus Device.
For the simple columns format, Inspect requires the data file starting with a text comment line within double quotation marks, followed by two columns of data, for example:
"This is a comment line."
1 0.1
2 0.5
3 0.9
...
To continue with this module:
- Start Sentaurus Workbench, and open the project Applications_Library/GettingStarted/inspect/mosextraction.
- Choose Extensions > Run Inspect.
1.3.2 Loading
To load a dataset, choose File > Load Datasets, and select one or more of the listed files.
In the following, it is assumed that the file IdVg_lin_des.plt has been chosen.
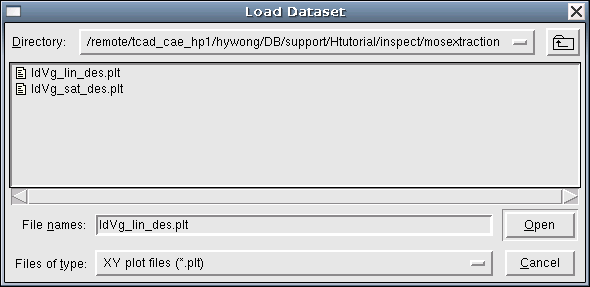
Figure 2. Load Dataset dialog box. (Click image for full-size view.)
After a dataset file has been loaded, its name is displayed in the Datasets group box. The middle pane lists the names of the data groups of the selected dataset file, and the bottom pane displays the names of the datasets belonging to the group.
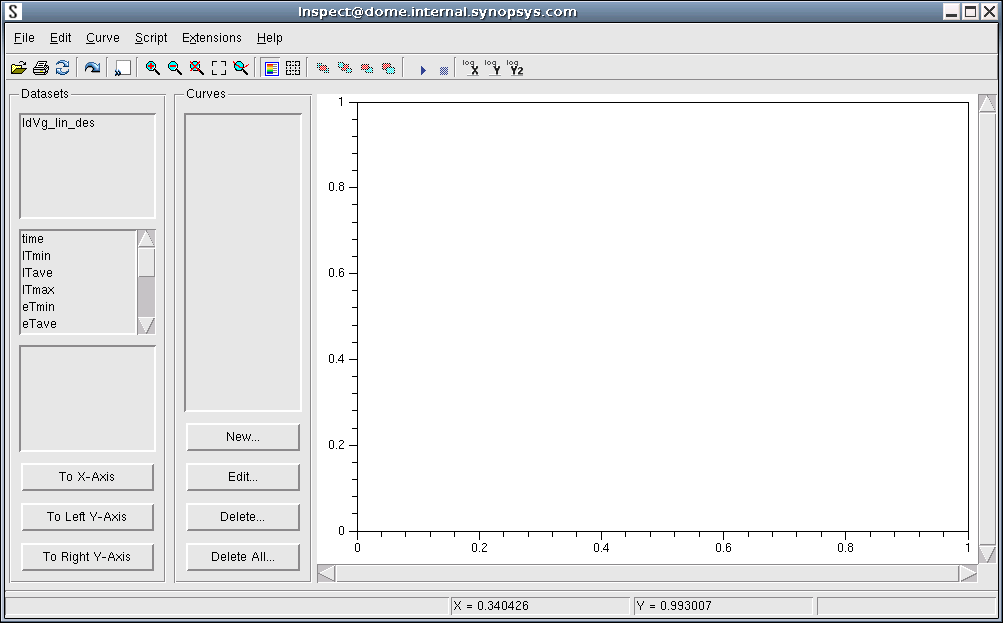
Figure 3. Main window showing dataset information in Datasets group box. (Click image for full-size view.)
1.4 Saving and Printing
Inspect supports several data-saving and data-exporting options.
1.4.1 Saving the Entire Session
An entire Inspect session, including its plots, axes, titles, labels, texts, and legends, can be saved.
To save an entire session:
- Choose File > Save All.
The session is saved with the extension .sav and can be subsequently restored by choosing File > Restore All when performed interactively, or by executing the following command at the command prompt:
> inspect <filename>.sav
1.4.2 Saving the Inspect Setup
The environment setups of the current Inspect session can be saved in a separate parameter file by choosing File > Save Setup.
The saved setup file can be loaded at a later time by choosing File > Load Setup. The default extension of the file is .par. The content of the file is everything that is in the .sav file except the actual datasets.
1.4.3 Exporting Curve Data
In Inspect, the data of the selected curves can be exported in different file formats, including CSV (comma-separated value), TDR, TXT (tab-delimited), XGRAPH, and XMGR.
To export curve data:
- Choose File > Export.
- Select the required format.
These file formats are recognizable and can be later loaded into Inspect.
1.4.4 Writing PostScript Files
To write a selected plot in the plot area to either an EPS or a PS file:
- Choose File > Write.
1.4.5 Writing PNG Files
To write a selected plot in the plot area to a .png file:
- Choose File > Write Bitmap.
- Specify a file name.
1.4.6 Printing
To print a selected plot in the plot area:
- Choose File > Print.
main menu | module menu | << previous section | next section >>
Copyright © 2017 Synopsys, Inc. All rights reserved.