Inspect
3. Math and Scripts
3.1 Mathematical Formulas
3.2 Macros
3.3 Scripts
Objectives
- To learn how to use mathematical formulas, macros, and scripts in Inspect.
3.1 Mathematical Formulas
This section uses the same IdVg_lin_des.plt data file from the project Applications_Library/GettingStarted/inspect/mosextraction.
This section demonstrates the idea of creating a new curve, based on a plotted curve. In Inspect, new curves can be created based on existing curves using mathematical functions that Inspect supports.
You will create a new curve from the already plotted Id–Vgs curve (see Section 2.1 Setting XY Datasets).
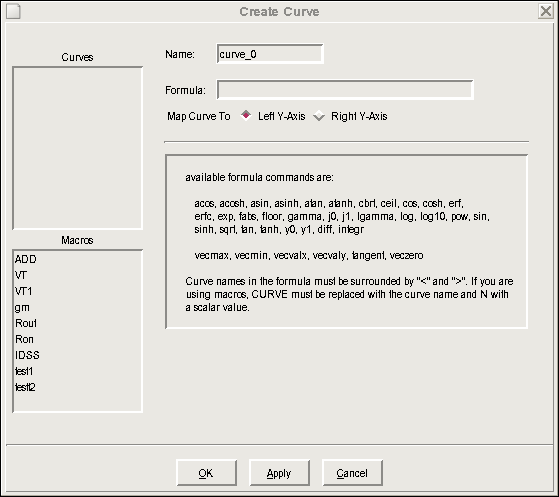
For this, click the New button in the Curves group box to display the Create Curve dialog box (see Figure 1).
Figure 1. Create Curve dialog box. (Click image for full-size view.)
This dialog box has several areas. The right pane lists available formula commands (mathematical functions) along with instructions on the syntax for using these functions. Some functions are ordinary mathematical functions, while others are specifically defined for handling curve data. For a complete list of these functions and their uses, refer to the Inspect User Guide.
The following examples demonstrate the uses of these functions.
3.1.1 Example 1: Finding the Maximum and Minimum Values
In this example, you will find the maximum and minimum values of the TotalCurrent_drain curve plotted in Section 2. Plotting Curves.
Two functions in the Available Formula Commands list, vecmax and vecmin, are designed to search for the maximum and minimum points of a curve.
To find the maximum point:
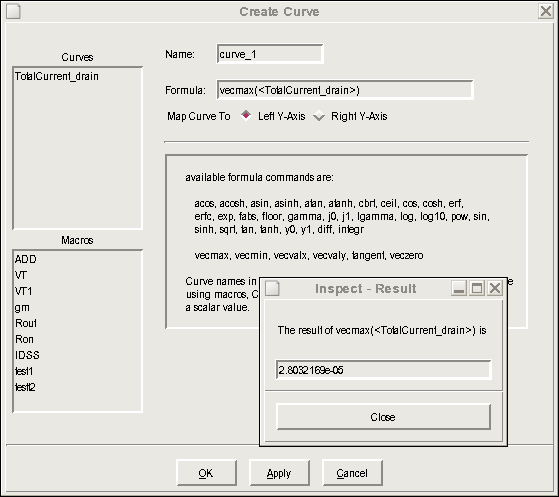
- Enter vecmax(<TotalCurrent_drain>) in the Formula field.
Both brackets are required for syntactical correctness. - Click the Apply button.
A dialog box is displayed that shows the maximum value of the selected curve (see Figure 2). The minimum value of the curve can be found in a similar manner using the function vecmin.
Figure 2. Result dialog box. (Click image for full-size view.)
3.1.2 Example 2: Calculating Derivatives
In this example, you will calculate the derivative of the TotalCurrent_drain curve.
The diff function in the Inspect formula library is especially designed for this purpose.
To find the slope of the TotalCurrent_drain curve:
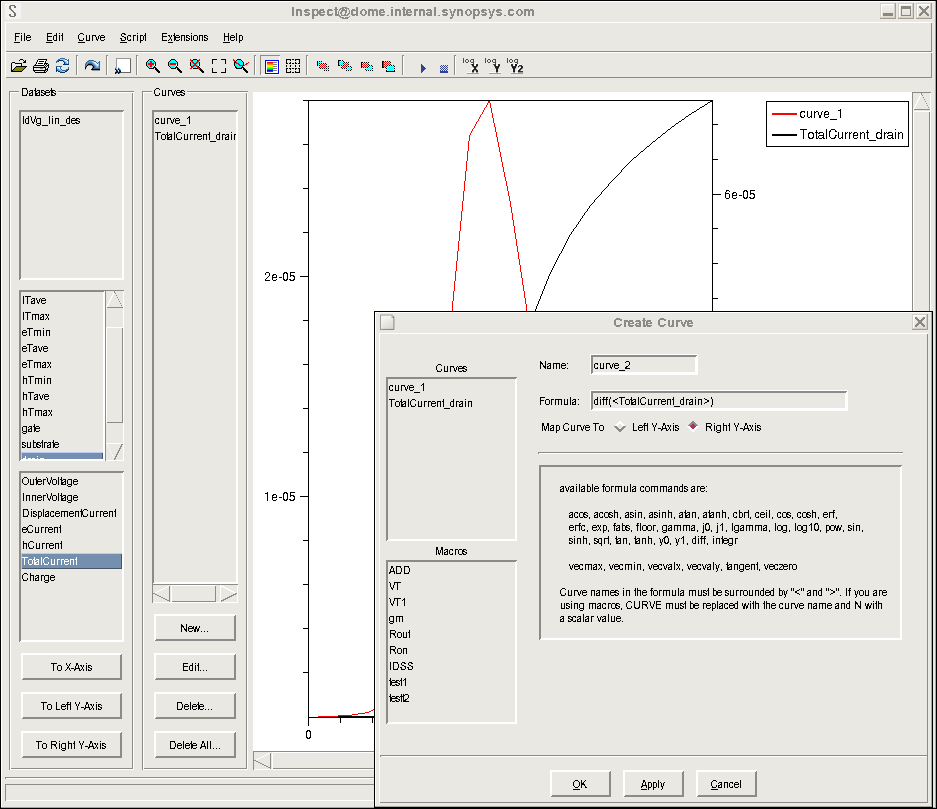
- Enter diff(<TotalCurrent_drain>) in the Formula field.
- Change the default name for the new curve to Diff_TotalCurrent_drain in the Name field.
- Change the Map Curve To option to Right Y-Axis.
- Click Apply.
A new curve is created, added to the Curves list, and displayed in the plot area (see Figure 3).
Figure 3. New Diff_TotalCurrent_drain curve displayed in the plot area. (Click image for full-size view.)
The difference between the diff function and the vecmax function is clear. Although both functions take a curve type of TotalCurrent_drain as their input, the vecmax function generates a number (a scalar) but the diff function creates another curve.
All the functions in the Inspect formula library behave the same way as these two functions. Most functions take one or more curves as input, and generate either a scalar quantity or a curve.
Inspect treats the two types of output differently, namely, it displays the scalar result in a dialog box, but it plots the curve result in the plot area. The newly created curve can be treated like any other curve for further processing, but the calculated scalar result is discarded after it has been displayed.
3.1.3 Example 3: Finding the Threshold Voltage
In this example, you will find the threshold voltage Vt of the previous TotalCurrent_drain curve using the definition of Vt as the intercept of the maximum slope line of the TotalCurrent_drain curve with the x-axis.
The problem can be solved in the following steps:
- Find the slope of the curve, that is, its derivative.
- Locate the maximum of the derivative.
- Extend the tangent line with the maximum slope to the x-axis to identify the intercept.
To understand these steps, look at the following command:
vecvalx(tangent(<c>, veczero(diff(<c>)-vecmax(diff(<c>)))),0.0)
where c represents a curve. This command works in this way:
- The diff function takes the derivative of the curve.
- The vecmax function finds the maximum of the argument, in this case, of the derivative curve.
- The veczero function returns the x value of a curve
at the point where the curve crosses the x-axis.
As a result, the inner command veczero(diff(<c>)-vecmax(diff(<c>))) returns the x value of the point on the TotalCurrent_drain curve with the maximum slope. - The tangent function returns a curve representing the tangent line of the curve <c 1> at the maximum slope point.
- The function vecvalx calculates the intercept point of the tangent line with the x-axis.
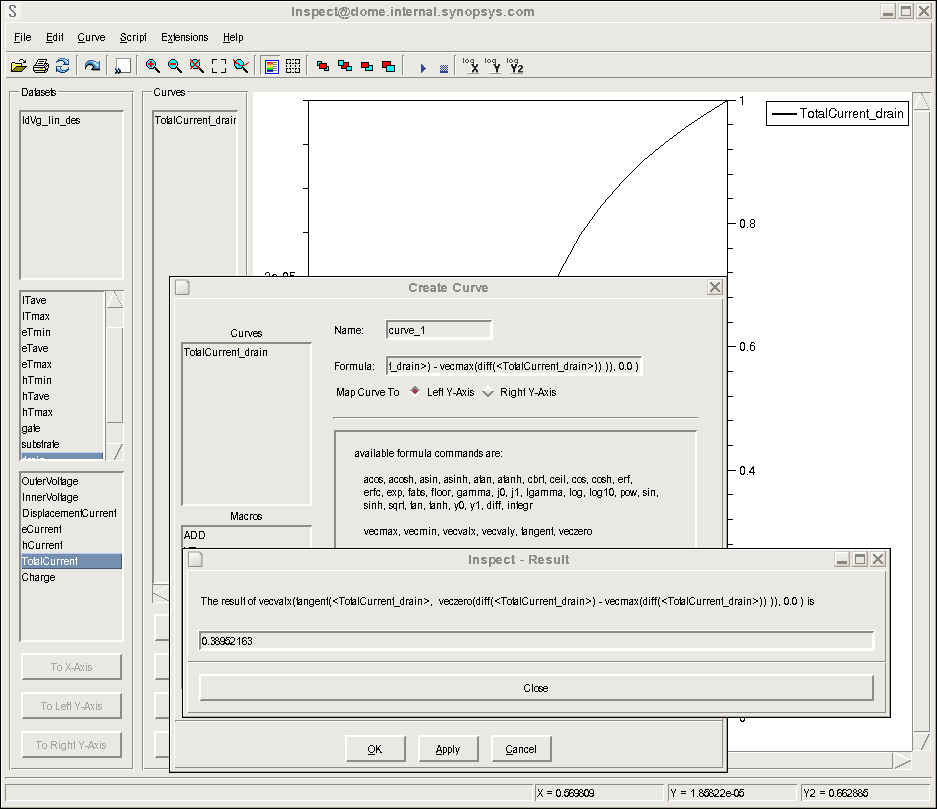
To find the Vt of the TotalCurrent_drain curve, replace the c curve with the TotalCurrent_drain curve, enter the command into the Formula field, and click Apply. The result is shown in Figure 4.
Figure 4. Threshold voltage value of the TotalCurrent_drain curve using the definition of Vt as the intercept of the maximum slope line of the TotalCurrent_drain curve. (Click image for full-size view.)
3.2 Macros
Macros are predefined commonly used commands. For example, in Inspect, there is a predefined macro VT that performs exactly the same threshold extraction as Example 3.
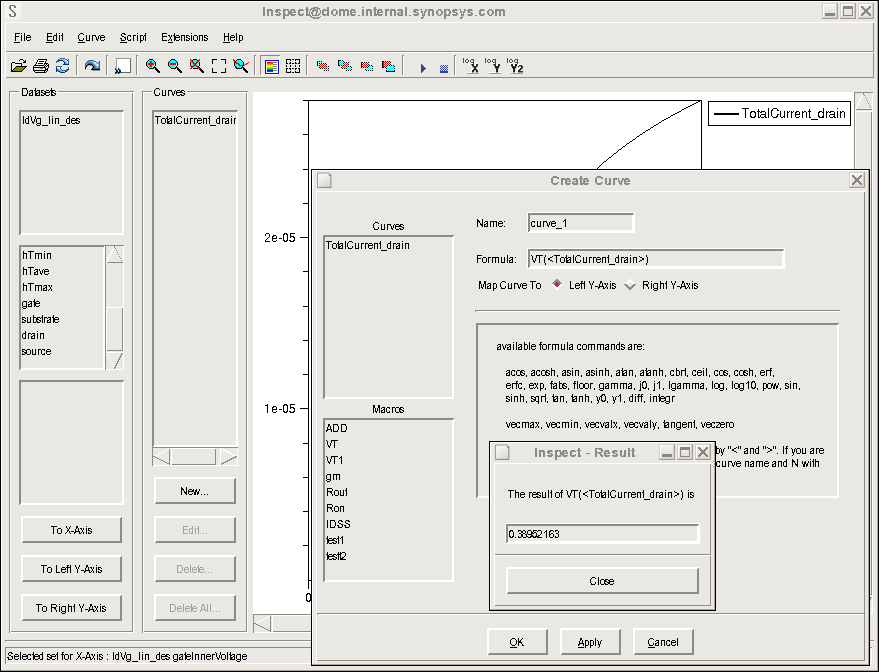
To repeat the task using the VT macro, enter VT(<TotalCurrent_drain>) in the Formula field, and click Apply. Note that this gives exactly the same result but in a much simpler way (see Figure 5).
Figure 5. Threshold voltage value of the TotalCurrent_drain curve using the macro VT. (Click image for full-size view.)
In Figure 5, the predefined macros are shown in the Macros list (ADD, VT, and so on), which can be used in the formula like ordinary mathematical functions listed in the right pane.
To define your own macros:
- Close the Create Curve dialog box.
- Choose Edit > Define Macros.
The Macro Editor is displayed. - To define a new macro, enter a name for the macro in the Name field.
- Enter the mathematical formula represented by the macro in the Macro field.
Macros can take one or more arguments, each of them is either a curve type or a scalar type depending on the role they play in the formula. The syntax for specifying argument placeholders is c_n for curves and s_n for scalars, where n is an integer used to distinguish between different arguments; n must start with 1 and then increase consecutively.
These argument placeholders are later replaced with real curves or scalars when the macro is called. For example, if you define a macro DIFFMULT as:
diff(<c_1>)+(<s_2>*<c_3>)
The correct way to call the macro is the form:
DIFFMULT(<CURVE>, <S>, <CURVE>)
The order of the replacement curves and the scalar as they
appear in this macro-calling command must match the physical order of
the arguments as they appear in the macro definition. On the other hand,
the order of the integers n as they appear in the macro definition
is irrelevant. For example, the following macro definition behaves identically
to the macro DIFFMULT and, therefore, can be called using the same
order of arguments as the above command:
diff(<c_3>)+(<s_2>*<c_1>)
3.3 Scripts
In addition to the GUI, Inspect can be controlled using the tool command language (Tcl). For example, a script can load a project (data file), draw curves, and perform mathematical computations on curves. A script can be written manually or created automatically by recording actions performed interactively through the GUI.
The Script menu of Inspect provides commands that can load and run a script file, write to a script file the actions that are performed using the GUI, continue the execution of a stopped script file, and terminate a running script file.
Inspect uses Tcl as its scripting language. For details about this language, go to http://www.tcl.tk or see the Tool Command Language module.
In Inspect, some commands have been added in the form of Tcl procedures to perform application-specific actions. You can create and add your own commands to the language. Most of these added commands in Inspect return a status string. A return status not equal to 1 indicates an error.
If an error occurs, Inspect prints an error message to the standard error output and terminates the execution of the script. The Inspect User Guide provides detailed descriptions of all these application-specific commands, with most of them being specifically designed for handling and processing data files and their plots.
For more explanations about scripting in Inspect, including examples, see Section 4. Extracting Standard Parameters.
Copyright © 2017 Synopsys, Inc. All rights reserved.

