
Inspect
4. Extracting Standard Parameters
4.1 Overview
4.2 MOS Parameter Extraction
4.3 BJT Parameter Extraction
4.4 Breakdown Parameter Extraction
Objectives
- To extract a range of device parameters using Inspect.
4.1 Overview
Parameter extractions are an integral part of device simulation. This section presents scripts for extracting standard electrical parameters based on the result of MOSFET and BJT simulations.
The examples are organized as Sentaurus Workbench projects, accessible from Applications_Library/Getting_Started/inspect. When an Inspect node is executed, it runs in batch mode without displaying graphics. At the end, the extracted quantities are displayed as Sentaurus Workbench variables.
To display the graphics, select a Sentaurus Workbench node and click the Run Selected Visualizer Nodes Together toolbar button.
4.2 MOS Parameter Extraction
This section discusses how to extract different MOSFET parameters, referencing the Sentaurus Workbench project found in the directory Applications_Library/Getting_Started/inspect/mosextraction.
Five Inspect tool instances are involved in this project. Each deals with the simulated NMOS Id–Vgs curve, loads it first, and then applies some computation to extract the necessary MOSFET quantities, such as:
- Threshold voltages and maximum transconductance
- Subthreshold swing
- Saturation (Ion) and leakage (Ioff) currents
- Measure of drain-induced barrier lowering (DIBL)
4.2.1 Threshold Voltage and Maximum Transconductance: Vtgm, gm, and V(gm)
The first Inspect tool instance in the project extracts the threshold voltage and the maximum transconductance values, and reports them as a project variables.
The threshold voltage is defined as the intersection of the tangent at the maximum conductance (gm) point with the x-axis (gate voltage).
Click to view the master file Vtgm_ins.cmd.
Because the procedure involves the computation of the maximum transconductance (gm), gm and the corresponding voltage are extracted as well. Loading data and displaying curves work the same way as explained in Section 2.1 Setting XY Datasets:
set ProjectName "IdVg_Vtgm"
set CurveName "IdVg(@node@)"

proj_load IdVg_lin_des.plt $ProjectName
The first two commands define a project name (which appears in the Datasets group box in Inspect) and a curve name (this appears in the Curves group box). The curve name is unique by making it dependent on the Sentaurus Workbench node. The third command reads in the data from the file from the previously performed NMOS simulation.
The following commands activate Id–Vgs curve plotting ("drain TotalCurrent" versus "gate OuterVoltage"), and specify the curve and axis plot attributes:
cv_createDS $CurveName "$ProjectName gate OuterVoltage"\
                       "$ProjectName drain TotalCurrent" y
cv_abs $CurveName y
cv_setCurveAttr $CurveName "IdVg(@node@)" red solid 2 none 3 defcolor 1 defcolor
gr_setAxisAttr X  {Gate Voltage (V)}     12 {} {} black 1 10 0 5 0
gr_setAxisAttr Y  {Drain Current (A/um)} 12 0.0 3.0E-5 black 1 10 0 5 0
Next, the transconductance is calculated as the derivative of the Id–Vg curve. The "diff" operator is used as explained in Section 3.1.2 Example 2: Calculating Derivatives. The transconductance is displayed on the right y-axis.
cv_createWithFormula TransCond(@node@) "diff(<$CurveName>)" A A
cv_display TransCond(@node@) y2
cv_setCurveAttr TransCond(@node@) "Transconductance(@node@)" blue solid 2 none \
  3 defcolor 1 defcolor
gr_setAxisAttr Y2  {Transconductance (S/um)} 12 {} {} black 1 10 0 5 0
The voltage at which the transconductance has its maximum is calculated. The calculation of the maximum of a curve and the calculation of a tangent to a curve are discussed in Section 3.1.2 Example 2: Calculating Derivatives.
set Vgm  [cv_compute "veczero(diff(<$CurveName>)-vecmax(diff(<$CurveName>)))" \
  A A A A ]
The tangent to the Id–Vg curve is calculated at the maximum transconductance, and the voltage at this point is extracted (Vtgm):
cv_createWithFormula Tangent(@node@) "tangent(<$CurveName>,$Vgm )" A A A A

set Vtgm [cv_compute "vecvalx(<Tangent(@node@)>, 0)" A A A A ]

set gm [cv_compute "vecmax(<TransCond(@node@)>)" A A A A ]
The tangent to Id–Vg is displayed:
cv_display Tangent(@node@) y
cv_setCurveAttr Tangent(@node@) "Tangent(@node@)" black dashed 2 none 3 \
With "puts", the extracted values are printed to the log file and, with "ft_scalar", they are written to the Sentaurus Workbench project:
puts "Vtgm=[format %.3f $Vtgm] V"
ft_scalar Vtgm [format %.3f $Vtgm]

puts "gm=[format %.3f $gm] S/um"
ft_scalar gm [format %.3e $gm]

puts "Vgm=[format %.3f $Vgm] V"
ft_scalar Vgm [format %.3f $Vgm]
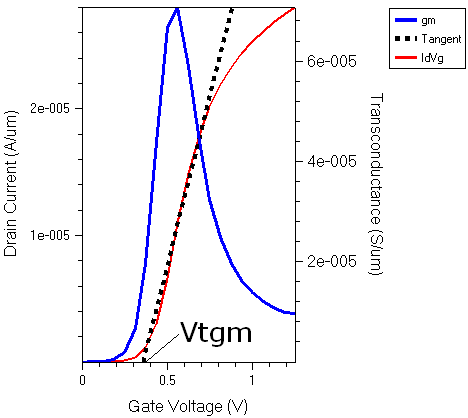
Figure 1. Extraction of threshold voltage using drain current versus gate voltage curve.
4.2.2 Constant Current Threshold Voltage: Vti
The second Inspect tool instance in the project extracts the transistor threshold voltage taken for the predefined current value. The threshold voltage (Vti) is defined as the gate voltage at which a given drain current level is achieved and is extracted. The same previously simulated I–V curve IdVg_lin_des.plt is used here.
Click to view the master file Vti_ins.cmd.
The current level is set as:
set CurrentLevel 1e-7
For better accuracy, the interpolation of curve points is performed on the logarithmic scale:
cv_log10Scale $CurveName $LogCurveName y
set LogCurrentLevel [expr log10($CurrentLevel)]

set Ivg0 [cv_compute "vecvaly(<$LogCurveName>, 1e-4)" A A A A ]
If a voltage for the given current level is found, it is displayed as Vti. Otherwise, an error message is printed to the log file:
if { $Ivg0 < $LogCurrentLevel } {
 set Vti [cv_compute "vecvalx(<$LogCurveName>, \
  $LogCurrentLevel)" A A A A ]
 puts "Vti (Vg at Id=[format %.3e $CurrentLevel]): [format %.3f $Vti] V"
 ft_scalar Vti [format %.3f $Vti]

} else {
 puts "Vti failed: leakage current [format %.3e $Ivg0_] higher\
 than the specified current level [format %.3e $CurrentLevel]!"
}
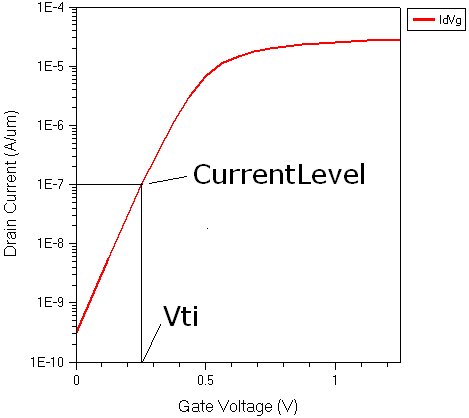
Figure 2. Extraction of constant current threshold voltage.
4.2.3 Subthreshold Swing: SS
The third Inspect tool instance in the project extracts the Id–Vgs curve subthreshold swing (SS). The subthreshold swing is defined as SS=(d(log10(Id))/d(Vgs))–1.
In this example, it is calculated at a point, where the current level is 10 times smaller than a specified on-current.
Click to view the master file SS_ins.cmd.
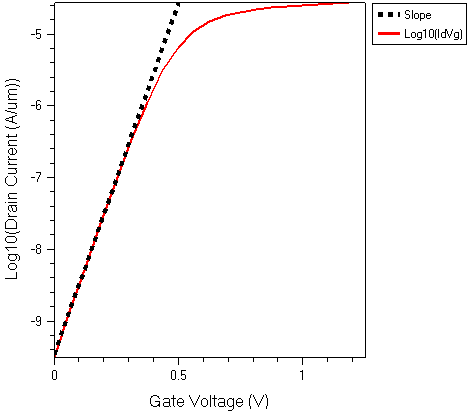
Figure 3. Subthreshold voltage swing versus gate voltage.
4.2.4 Saturation and Leakage Currents: Ion and Ioff
The saturation current is the drain current at a given gate voltage (V(gate)=Vdd) and a given drain voltage. The leakage current is obtained at a given drain voltage at V(gate)=0.0. The simulated I–V curve is IdVg_sat_des.plt.
Click to view the master file ionioff_ins.cmd.
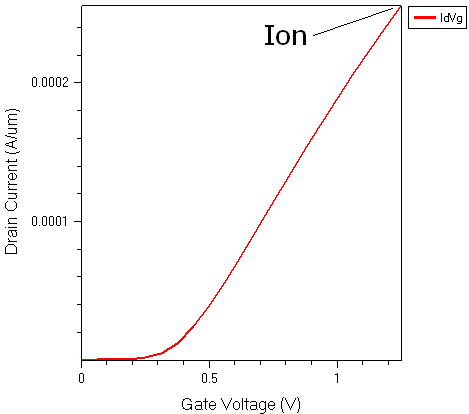
Figure 4. Extraction of saturation current Ion from drain current versus gate voltage curve.
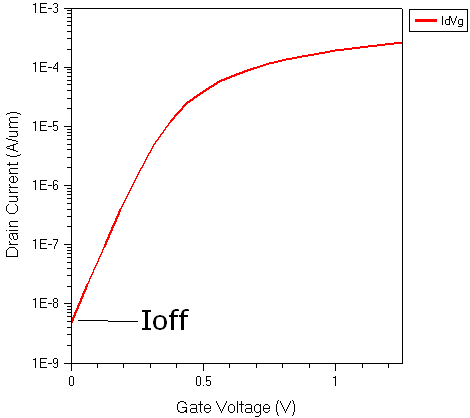
Figure 5. Extraction of leakage current Ioff from drain current versus gate voltage curve.
4.2.5 Drain-Induced Barrier Lowering: DIBL
DIBL is defined as a gate voltage shift between the Id–Vgs curves of two transistors, needed to achieve a constant drain current level (Id), which occurs due to the drain-induced barrier lowering. It is calculated from two Id–Vgs curves (IdVg_lin and IdVg_sat), which are transistor transfer characteristics computed at two different drain voltages.
Click to view the master file dibl_ins.cmd.
This project illustrates the capability to define Tcl procedures:
proc GetVti { CurveName CurrentLevel } {
 cv_log10Scale $CurveName ${CurveName}_log y
 set LogCurrentLevel [expr log10($CurrentLevel)]

 set Ivg0 [cv_compute "vecvaly(<${CurveName}_log>, 1e-4)" A A A A ]

  if { $Ivg0 < $LogCurrentLevel } {
  set Vti [cv_compute "vecvalx(<${CurveName}_log>, $LogCurrentLevel)" A A A A ]
 } else {
  set Vti -99
 }
 return $Vti
}
This procedure extracts the threshold voltage (Vti) at a given current level. It returns Vti if the extraction is successful; otherwise, it returns the value –99. The procedure is used to calculate the threshold voltages from the Id–Vg curves simulated for two different drain voltages:
set Vti_lin [GetVti $CurveName_lin $CurrentLevel]
set Vti_sat [GetVti $CurveName_sat $CurrentLevel]
DIBL is calculated as the change in threshold voltage per drain voltage change:
set DIBL [expr ($Vti_lin-$Vti_sat)/($Vd_sat-$Vd_lin)]
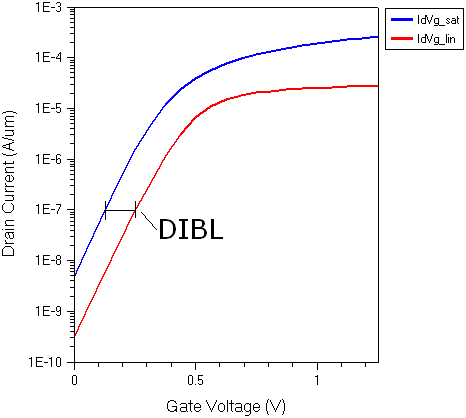
Figure 6. Extraction of DIBL from drain current versus gate voltage curve.
4.3 BJT Parameter Extraction
This section discusses how to extract different bipolar junction transistor (BJT) parameters.
The complete project can be investigated from within Sentaurus Workbench in the directory Applications_Library/Getting_Started/inspect/bjtextraction.
4.3.1 DC Gain
The precomputed I–V plot file Gummel_des.plt is used in this project.
The BJT DC gain is defined as the ratio of collector current to base current: Ic/Ib. The maximum of this curve is a figure of merit for bipolar transistors, and it is extracted in this example.
Click to view the master file gain_ins.cmd. This master file is designed to extract the BJT maximal gain value.
For very small base voltages, the currents are on their low limit, therefore, their ratio can exhibit unwanted noisy behavior. To avoid this, the current ratio is evaluated only above a certain base voltage (0.4 V in this example):
cv_createWithFormula Gain <${CurveName}_Ic>/<${CurveName}_Ib> 0.4 A
The maximum gain is extracted in the same way as the quantities in previous examples:
set MaxGain [cv_compute "vecmax(<Gain>)" A A A A]
Figure 7 shows Ic(Vbe) and Ib(Vbe) together with the gain curve.
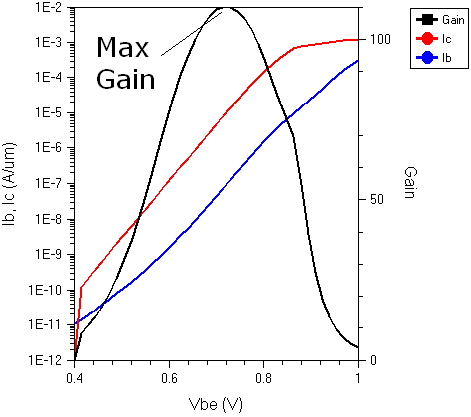
Figure 7. Extraction of DC gain from collector and base current curves.
4.3.2 Early Voltage
Early voltage is defined as an interception point of the tangent of the Ic–Vce characteristic, taken at a relatively large Vce voltage, extrapolated backwards to intercept the voltage axis.
The precomputed I–V plot file IcVc_des.plt is used in this project.
Click to view the master file va_ins.cmd.
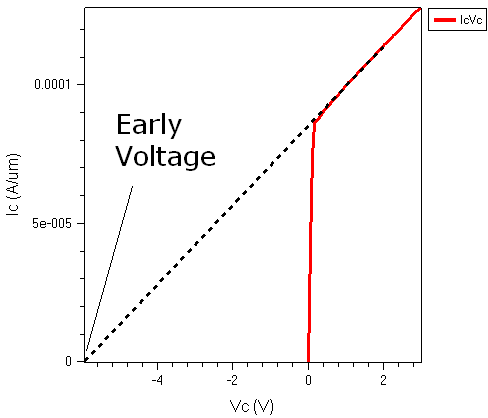
Figure 8. Extraction of Early voltage from collector current curve.
4.4 Breakdown Parameter Extraction
This section discusses how to extract different breakdown voltage (BV) parameters from a precomputed I–V curve.
The complete project can be investigated from within Sentaurus Workbench in the directory Applications_Library/GettingStarted/inspect/bjtextraction.
4.4.1 Breakdown Voltage: BV
The precomputed I–V plot file BV_des.plt is used in this project.
One popular method for device breakdown simulation performed with Sentaurus Device is the external resistor method (see Section 11.5 External Resistor Method), where a series resistor is attached to a biased electrode. Having such a resistor automatically facilitates a switch from a voltage control in the prebreakdown regime to a current control in the postbreakdown regime.
The value of the resistor should be of the order of RBV = VBV/IBV, where VBV and IBV are the voltage and current values at the onset of breakdown, respectively. If such a resistor is used, the InnerVoltage must be selected for the x-axis when plotting in Inspect.
Click to view the master file bv_ins.cmd. The master file shows the commands needed to extract the BV voltages from the simulated MOSFET Id–Vds on-state characteristic.
For breakdown simulations, InnerVoltage is not a monotonic curve. Therefore, a list of values of InnerVoltage is created, and a second list contains the corresponding currents:
set VList [cv_getValsX $CurveName]
set IList [cv_getValsY $CurveName]
Then, the maximum value in the list VList is searched. This voltage is extracted as the BV_vmax variable in the project. The list of currents is searched for the entry at which the current is higher than a predefined value (here, 4*10–3). Then, the corresponding voltage is extracted as the BV_ilevel variable value in the project.
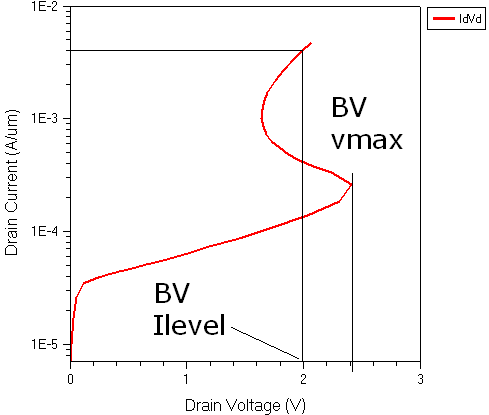
Figure 9. Extraction of breakdown voltage parameters from Id–Vds curve of simulated MOSFET.
Copyright © 2017 Synopsys, Inc. All rights reserved.