
Inspect
2. Plotting Curves
2.1 Setting XY Datasets
2.2 Customizing Plots
2.3 Miscellaneous Features
Objectives
- To plot and customize a curve in Inspect.
2.1 Setting XY Datasets
Since a data file can contain several datasets, Inspect requires the xy datasets to be specified explicitly in the graphical user interface (GUI) or within a script after the data file has been loaded.
The To X-Axis, To Left Y-Axis, and To Right Y-Axis buttons are used for this purpose.
To perform the following procedure, download the following file by right-clicking and selecting Save Target As:
Then, follow these steps:
- Launch Inspect and load the IdVg_lin_des.plt file by choosing File > Load Dataset.
- Select the IdVg_lin_des data file from the top pane of the Datasets group box.
- Select gate from the middle pane.
- Select the OuterVoltage dataset from the bottom pane.
- Click the To X-Axis button.
- Select drain from the middle pane.
- Select the TotalCurrent dataset from the bottom pane.
- Click the To Left Y-Axis button.
- Move the legend in the plot area by placing the cursor on it and holding the middle mouse button.
You should see the IdVgs curve as shown in Figure 1.
Multiple datasets can be assigned to the same y-axis if required.
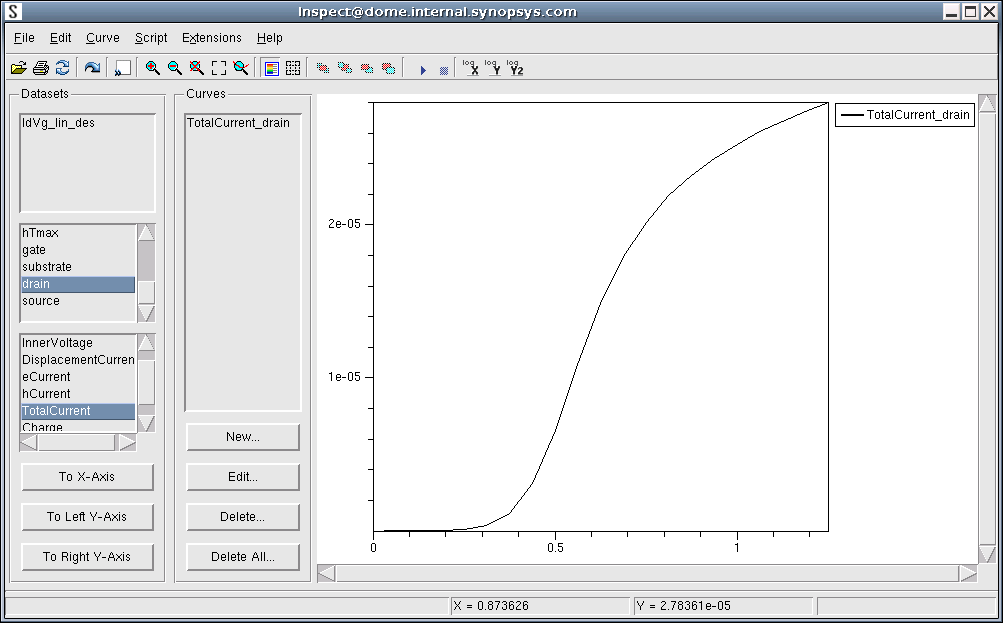
Figure 1. Gate outer voltage versus total current drain. (Click image for full-size view.)
2.2 Customizing Plots
When the xy datasets have been specified and a plot is generated, the attributes of the plot, including the curve and its axes and legend, can be changed.
2.2.1 Curve Attributes
To change the attributes of a curve:
- Select the curve from the Curves group box.
- Click the Edit button.
The Curve Attributes dialog box is displayed (see Figure 2).
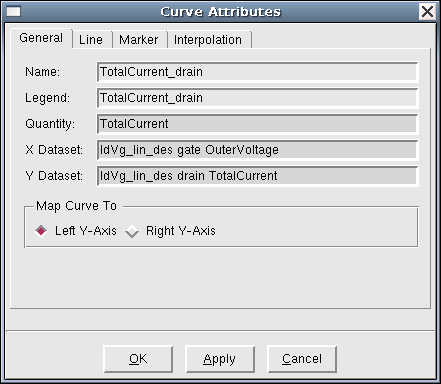
Figure 2. Curve Attributes dialog box.
This dialog box has the following tabs:
- The General tab is used to change the name and the legend of the plot. By default, if the input data is a TDR format file, Inspect uses a combination of the physical quantity name (TotalCurrent) and the data group name (drain) of the y-axis to generate the name and the legend of the plot. On this tab, you also can change the mapping of the selected dataset between the two y-axes.
- The Line tab is used to change the attributes of the line used to plot the curve, including its color, width, and style.
- The Marker tab includes options to change the attributes of the marker, which is used to label the data points. These options include the shape and size of the marker, its outline color and width, and its fill color.
- The Interpolation tab is used to select the interpolation scheme, which is needed to compute the data values of the curve outside the data points. The available options are lin, log, and auto.
2.2.2 Plot Area
To change the attributes associated with the plot area:
- Choose Edit > Plot Area.
The Plot Area dialog box is displayed (see Figure 3).
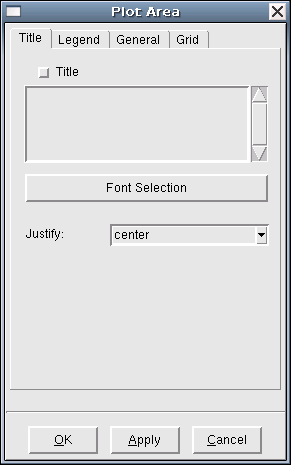
Figure 3. Plot Area dialog box.
This dialog box has the following tabs:
- The Title tab is used to change the title of the plot and its font and size. The placement of the title can be to the center, left, or right.
- The Legend tab is used to adjust the placement of the legend, including its font and size, its background and foreground colors, its frame styles and positioning, as well as whether to display the legend at all.
- The General tab allows you to work on the frame of the plot, including its background and foreground color.
- The Grid tab controls the display of the grid in the plot area, including its width, color, style, and alignment.
2.2.3 Axes Attributes
To change the axes of the plot:
- Choose Edit > Axes.
The Axes dialog box is displayed (see Figure 4).
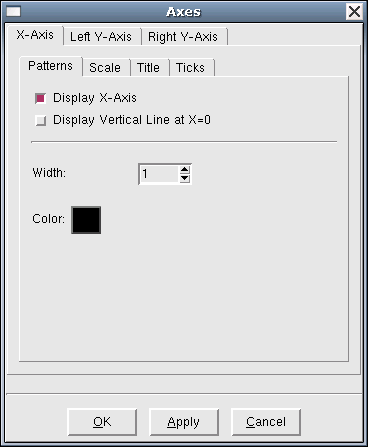
Figure 4. Axes dialog box.
Each of the three axes can be selected and changed independently:
- The Patterns subtab is used to change the size and color of the selected axis, as well as to select to show the axis.
- The Scale subtab is used to switch between linear and logarithmic scales, and to set the maximum and minimum limits for the axis.
- The Title subtab controls the display of the title of the axis, including its font, size, and color.
- The Ticks subtab controls the placement of ticks along the axis, including their size, type, and their subdivision and placing angles.
2.2.4 Labels
To add labels to the plot:
- Choose Edit > Labels > Add.
The Labels dialog box is displayed (see Figure 5).
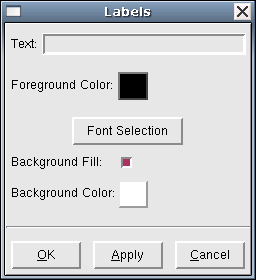
Figure 5. Labels dialog box.
Any valid text can be used to name the label. In addition, you can specify the font and color of the label.
The label initially resides in a place close to the middle of the plot. To move it to a different location, with the pointer on the label, click the middle mouse button and drag the label to a new location.
To edit a label:
- Choose Edit > Labels > Edit.
- Click the label.
The Labels dialog box is displayed. - Edit the text of the label.
- Click Apply.
To remove a label:
- Choose Edit > Labels Remove.
- Click the label to be deleted.
2.3 Miscellaneous Features
In addition to curve-plotting functions, Inspect supports other functions that are designed to facilitate easy viewing and inspection of data. Most curve-related functions are located under the Curve menu; view-related functions are accessible from the toolbar.
2.3.1 Curve-Related Features
Curve-related features of Inspect include:
- The Curve Data command displays a spreadsheet of
the dataset corresponding to the selected curve. Data points can be
selected and deleted from the dataset. This operation, however, affects only
internal data. It does not remove any points from the input
data file.
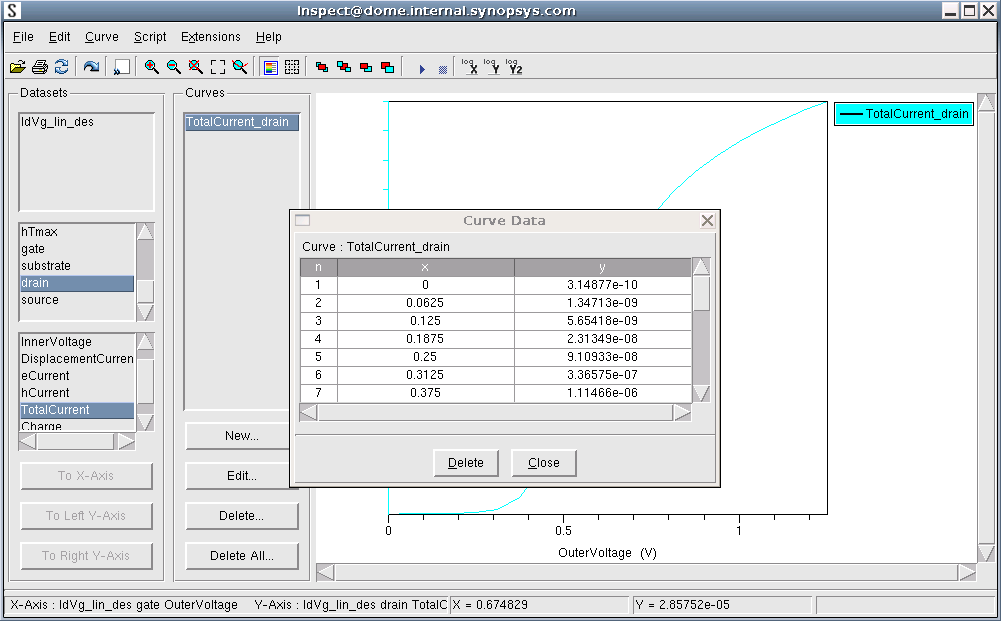
Figure 6. Inspect showing Curve Data dialog box. (Click image for full-size view.)
- The Restore Data command performs the opposite. It restores all the data points that have been previously removed from the dataset.
- The Intersect X ? command calculates the value of the intersection of the selected curve with the x-axis if it exists.
- The Inspector command opens the Inspector dialog box (see Figure 7), which allows you to mark two points on the curve (using a drag-and-drop operation) and then to compute the coordinates of the two points and their differences.
For detailed descriptions of these commands, refer to the Inspect User Guide.
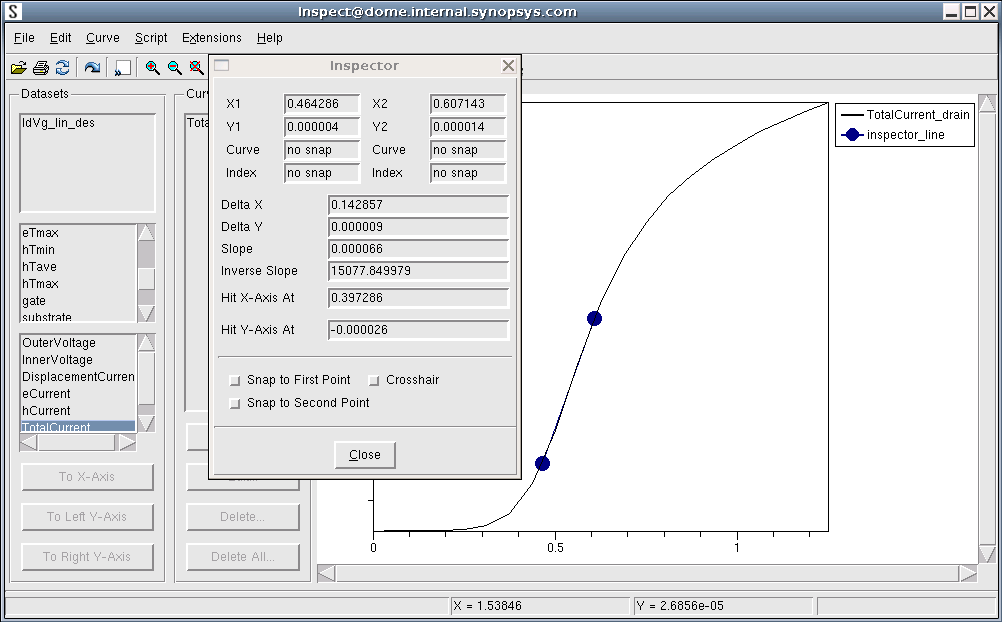
Figure 7. Inspect main window showing Inspector dialog box. (Click image for full-size view.)
2.3.2 View-Related Features
On the toolbar, several buttons can be used to enhance the view of the selected curve. The set of zoom buttons have standard functions and the order buttons can reorder plots and, therefore, change their visibility.
Copyright © 2017 Synopsys, Inc. All rights reserved.